4. PROSTATE ANATOMY
There is a requirement to be intimately familiar with the gross and glandular anatomy of the prostate as well as its ultrasound appearance (Fig. 2, 3, 4, 5).
4.1 Gross anatomy
In the post-pubescent man the prostate gland has a volume of up to 25 ml, being approximately 3.5 cm long, 4.0 cm wide and 2.5 cm deep from posterior to anterior, which is about the same size as a walnut.
The prostate is an extraperitoneal structure, lying anterior to the rectum and at the bladder neck. The prostate encircles the urethra and it empties its secretions into the urethra. It comprises a number of smaller glands that are surrounded by smooth muscle and connective tissue. During ejaculation the smooth muscle contracts and compresses the glands, forcing secretions into the urethra. Prostatic secretions contain several enzymes including PSA that help to liquefy semen by breaking down coagulation factors plus citrate, which the sperm uses for energy.
Between the gland and the rectum lies Denonvilliers’ fascia – an obliterated peritoneal plane or a potential space. The prostate shape conforms to the anatomical limitations of the deep pelvic boundaries, and it looks like an inverted cone or pyramid. On either side are the levator ani and obturator internus muscles. The base of the inverted cone lies against the bladder and the apex on the urogenital diaphragm; a fibrous supporting ring that also contains the urethra. The gland is surrounded by the prostate (pseudo) capsule.
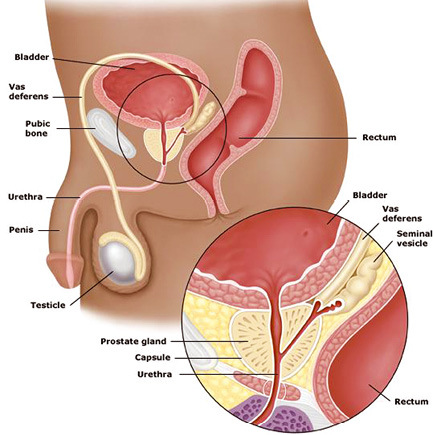
Fig. 2 Gross anatomy – male reproductive and urinary system
[Source: unknown]
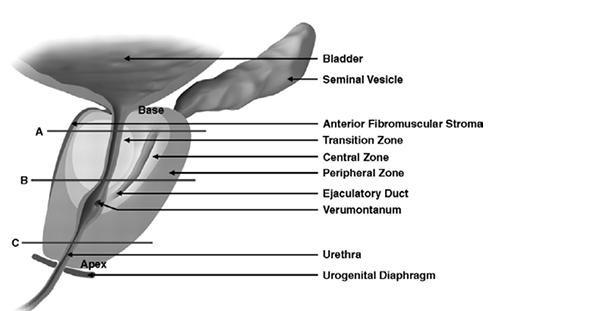
Fig. 3 Gross anatomy – prostate ((sagittal) - A base, B mid, C apex of gland
Copyright © 2009, AJR Online by American Roentgen Ray Society (Permission see page 44)
4.2 Zonal anatomy
Three glandular regions can be identified in the prostate: central, peripheral and transition zones. There is a further non-glandular area called the anterior fibromuscular stroma.
The peripheral zone accounts for 75% of the prostate tissue in young men but the transition zone increases in size with ageing due to benign prostate enlargement (BPE), while the central zone atrophies and the peripheral zone stays static. Thus, for clinical purposes the important regions are the peripheral and transition zones.
It is the peripheral zone in which the majority of prostate cancers occur, whereas BPE arises in the transition zone.
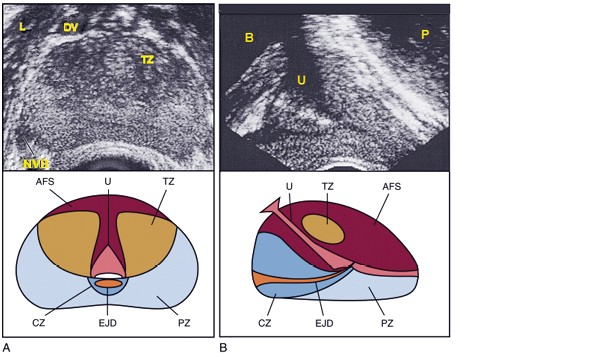
Fig. 4 Normal prostate ultrasound images with zonal anatomy
Normal prostate ultrasound images (top) with diagrams (bottom) at approximately the level of the verumontanum demonstrating zonal anatomy. A, Transverse view. B, Sagittal view. AFS, anterior fibromuscular stroma; CZ, central zone; DV, dorsal vascular complex; EJD, ejaculatory ducts; NVB, neurovascular bundle; L, levator muscles; PZ, peripheral zone; TZ, transition zone; U, urethra.
[Source: Campbell Walsh Urology, permission see page 44.]
Fig. 5 Ultrasound image of transition and peripheral zone
(Courtesy of: S. Hieronymi)
4.3 Vascular anatomy
The prostate has a rich arterial blood supply. The prostate artery is a branch from the inferior vesical artery (Fig. 6), a branch of the internal iliac artery, which divides into capsular and urethral arteries. Branches of the inferior vesical artery supply the seminal vesicles and occasionally the base of the gland. Santorini’s venous plexus lies anteriorly and has small perforating vessels into the prostate. The neurovascular bundles lie postero-laterally at 5 and 7 o’clock and contain the branch arteries, veins and nerves that go to the penis and urethral sphincter.
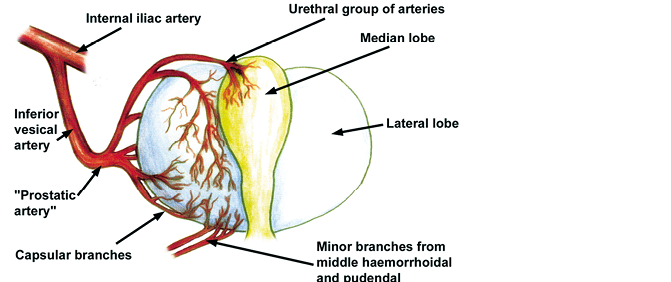
Fig. 6. Prostate arterial supply
(Source: eMedicine.com, permission see page 44)
4.4 Prostatic urethra
The prostatic urethra runs through the prostate from the base of the bladder to the apex of the prostate. It is a midline structure unless there is asymmetric glandular enlargement. There is a triangulated portion at the verumontanum where the ejaculatory ducts drain into the urethra. There is a variable amount of smooth muscle around the urethra and this, with the urogenital margin, accounts for its visibility on ultrasound in the collapsed state.
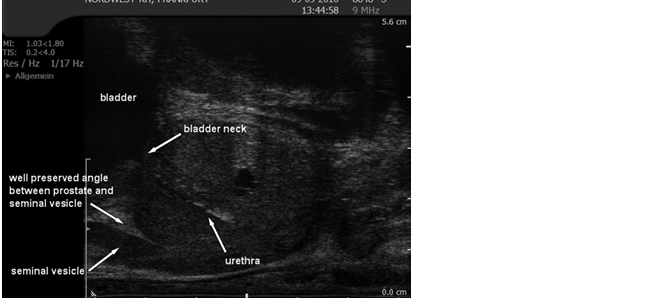
Fig. 7. Ultrasound of the gross anatomy of the prostate demonstrated on TRUS
(Courtesy: S. Hieronymi)
4.5 Seminal vesicles and ejaculatory ducts
The seminal vesicles are paired sac-like structures of variable size and shape and lie just posterior and superior to the base of the prostate. A minor degree of asymmetry is common. The paired ejaculatory ducts formed by the union of the vas deferens and the seminal vesicles run through the prostate in the central zone. They communicate with the prostatic urethra at the verumontanum. [13–15] See Fig. 7, section 4.4.
4.6 Prostate cancer, grading and staging
The incidence of prostate cancer varies considerably internationally with the lowest incidence in Southeast Asia and highest in Australia/New Zealand and Northern Europe. The age-standardised incidence rates range from around 5.0 per 100,000 in Asia to 86.4 per 100,000 in Australia/New Zealand. [16] In any one population the incidence is higher in men of Afro-Caribbean heritage than Caucasians. [17] Across the world mortality rate varies from about 3.3 to 10.2 per 100,000. [16] Worldwide, prostate cancer is among the most common cancers, with an estimated 1,276,106 new cases and 358,983 deaths in 2018. [18] The incidence of prostate cancer has increased significantly over the past two decades; almost exponentially in some areas. [19–21] This increased incidence is explained by the introduction of the PSA blood test [22,23] and an ever-ageing population.
Autopsy studies have shown that the prevalence of prostate cancer increases sharply with age, and foci of prostate cancer can be detected in up to 70–80% of 80-year-old men who have died of other causes. [24–26] In contrast to the rate of clinical or biopsy-detectable prostate cancer, there was no significant international difference in the incidence of prostate cancer in autopsy studies. [24,25] International variation in the incidence of prostate cancer, and the fact that incidence increases in the first and second generations of migrants from low- to high-risk areas, indicate that the manifestation of clinically significant prostate cancer depends on exogenous factors. [27–29]
Grading
The original prostate cancer grading system was developed in 1966–1974 by Donald Gleason. [30,31]. Since then, several consensus meetings have helped to improve and update the histological interpretation of prostate cancer. [32,33] The latest World Health Organization classification was released in 2016. [33]
The Gleason grading system is based on the architectural pattern of the tumour, and the grade is defined as the sum of the two most common grade patterns (Gleason score; GS). [30,31,34] The primary predominant and secondary (second most prevalent) architectural patterns are assigned a number from 1 (most differentiated) to 5 (least differentiated). It is now recognised that, in most circumstances, Gleason grade (GG) should only be given from 3 to 5. GG 1 is ultimately a benign feature, and was mistaken for tumour tissue before the era of immunohistochemistry. GG 2 should not be given to prostate biopsy specimens. [32] Therefore, if only GG 3 is seen on the biopsy, the tumour has to be reported as 6 (3+3). In case of mixed features of GG 3 and 4, the predominant amount will be placed first as either (3+4) or (4+3). However, as the presence of even a small focus of GG 5 pattern tumour may be prognostic, in the case of a tumour with a large amount of GG 3 and a significant amount of GG 4 but only 5% GG 5, the cancer should be reported as (3+5). Each biopsy is to be reported separately and it appears that the highest GS is what drives prognosis even if this is only found in a single biopsy.
Consequently, this has resulted in an odd situation in which biopsy GS ranges from 6 to 10. This has been resolved with the introduction of the Gleason Grade Groups (GGGs). These grade groups are numbered from 1 to 5 with GS 6 (3+3) as the lowest and least aggressive group (GGG 1). This is especially important for GS 7 (3+4) and 7 (4+3). These two settings have a different outcome, and the new GGG system allows one to make a clear distinction between GGG 2 [7 (3+4)] and GGG 3 [7 (4+3)] [12,35,36]. The new system is also known as ISUP Grade Groups after the consensus conference in 2014 where they were agreed.
Table 3. ISUP Grade Groups
| Gleason score | ISUP Grade group |
| 6 (3+3) | 1 |
| 7 (3+4) | 2 |
| 7 (4+3) | 3 |
| 8 (4+4); 8 (3+5); 8 (5+3) | 4 |
| 9 (4+5); 9 (5+4); 10 (5+5) | 5 |
Staging
Table 4. Tumour Node Metastasis (TNM) classification of PCa [52]
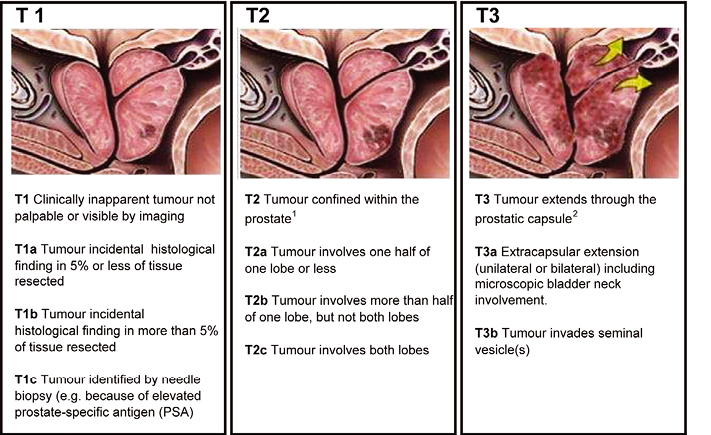
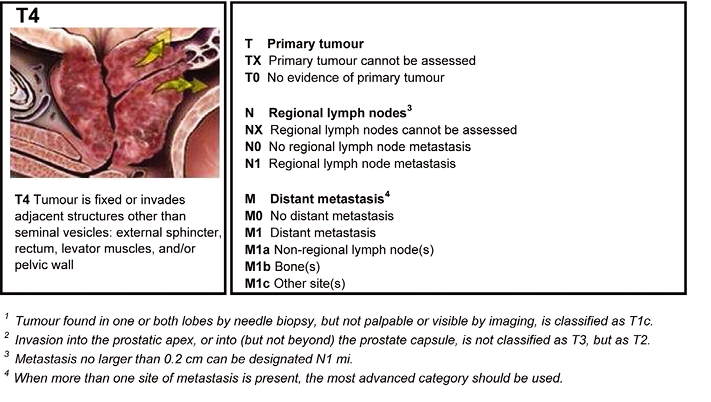
 Adapted from Sobin (2009). [37]